The September bill
It looks like any other month.
₹16,99,845 across seven lines. Nothing on the page says which rupees you could have kept.
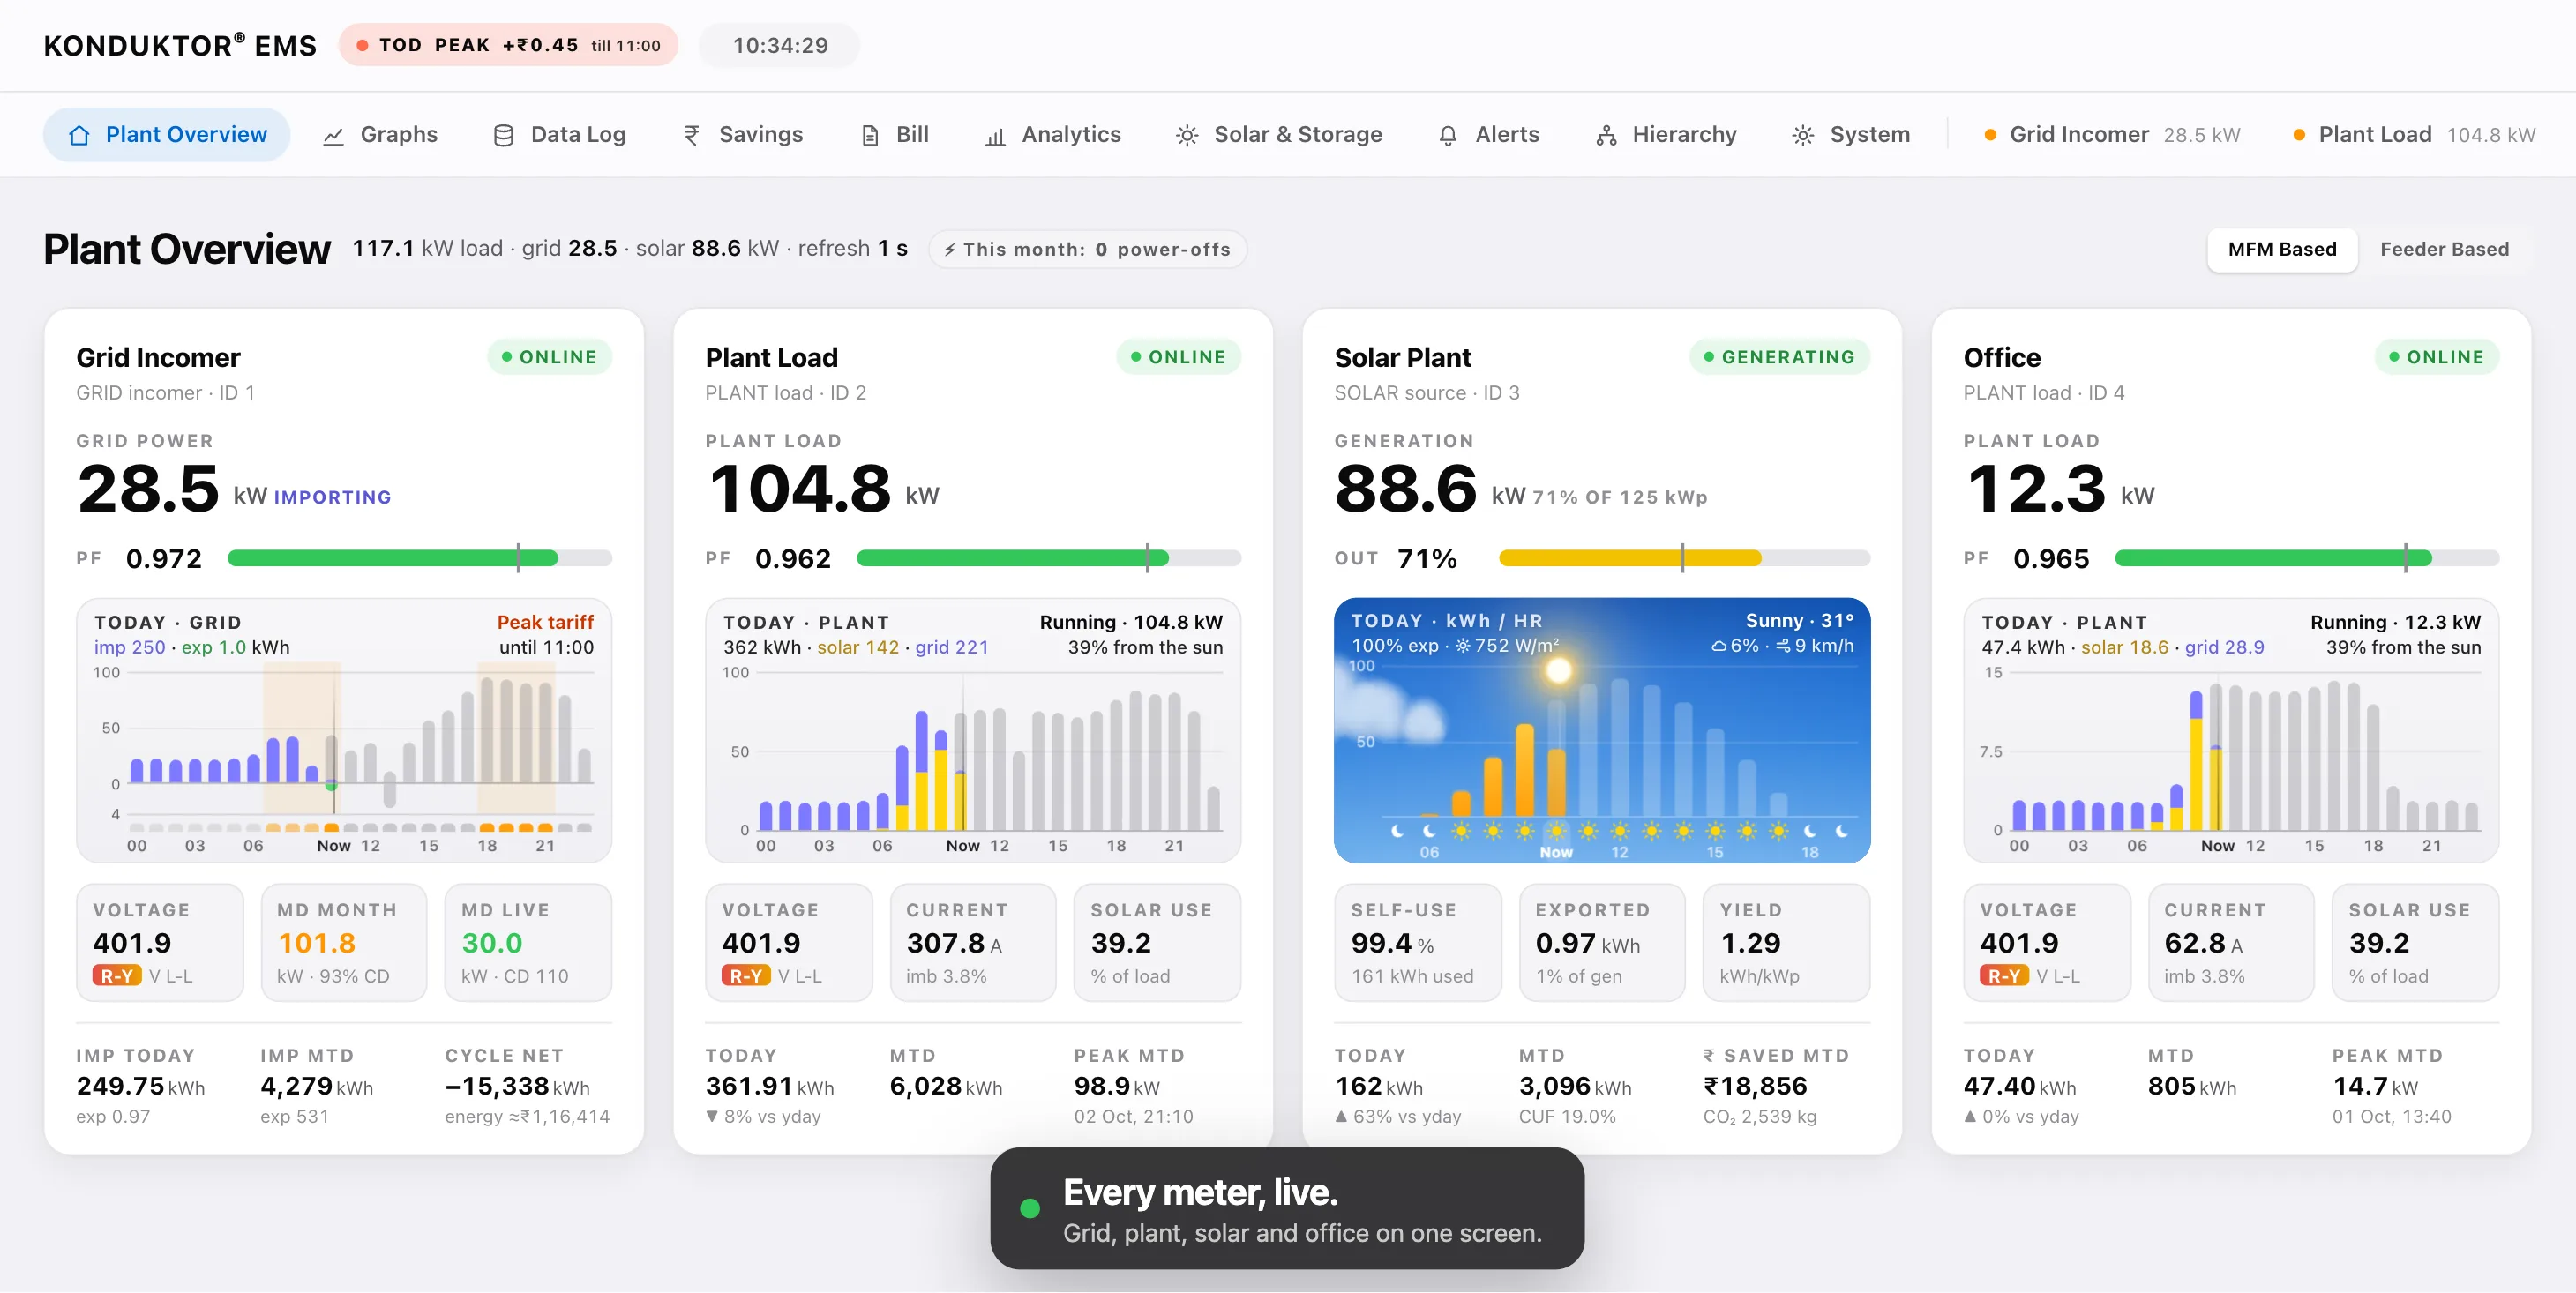
KONDUKTOR® EMS watches every connected meter in real time, so load spikes, poor power factor and idle loads get caught before they show up on your bill.
By the time the monthly bill arrives, the costly moments behind it are already over. Scroll through one ordinary bill and see what each line was hiding.
Total payable₹16,99,845
Load through the month · kVA
Avoidable so far₹0
₹16,99,845 across seven lines. Nothing on the page says which rupees you could have kept.
Day 15 touched 96% and nobody saw it. On Day 24, heavy motors started together at 11:42 and demand reached 560 kVA.
At 02:20 Machine 2 still drew 6.2 kW with production at zero. Four shut Sundays used another 856 kWh.
At 19:30 the plant was close to full load inside the peak window, when every unit costs 15% more.
Motors pulled PF down to 0.84 at 14:30, under the 0.90 limit. The month closed at 0.87.
Each of these showed up on the day it happened. KONDUKTOR® EMS catches it as it forms, then acts through Modbus I/O cards, engineered for your plant as part of your project.
See this on your own billMove beyond recording consumption. See the operating conditions that influence penalties, waste and production efficiency.
Track Running Maximum Demand against Contract Demand. Colour-coded warnings give your team time to respond.
Locate poor PF conditions, identify affected feeders and evaluate the required correction—including capacitor-sizing guidance.
See when equipment is running, idle, stopped or overloaded—and estimate non-productive consumption.
Identify loads operating during expensive TOD periods and evaluate opportunities to shift them.
Use historical MD patterns to evaluate whether booked demand matches the plant’s actual requirement.
Track Specific Energy Consumption and compare production efficiency across operating periods.
Compare shifts, days, feeders and historical operating patterns before and after corrective action.
See decision-ready analytics →Set alerts for demand, power factor, voltage, current and meter communication, and let each machine’s own history set its limits. Then let the system act: shed load before CD, pause loads in peak tariff hours, switch off idle machines and hold solar export at zero where the inverter allows it.
Event log
A green dot means the system acts on its own through Modbus I/O cards, engineered for your plant as part of your project. See demand control
Understand where, when and why energy performance changes—not just the final kWh total.
See, in 15-minute or hourly blocks, the times and days when factory demand is consistently highest.
Compare consumption across production shifts and operating schedules.
Review long-term MD patterns for demand planning and Contract Demand decisions.
Review energy, demand, TOD, fixed charges and tariff inputs before the official bill arrives — see where load shifting could cut cost.
Export meter, billing and historical data for finance reviews, audits and analysis.
Track monthly CO₂-equivalent alongside energy use for internal sustainability reporting.
Cloud platforms can simplify remote access, but they can also introduce Internet dependency, off-site data storage and less control over operational history. KONDUKTOR® EMS keeps core monitoring inside your factory while providing secure remote access when required.
IIoT energy monitoring that stays inside your plant: your meters, your gateway, your data — no cloud server in between. See how an on-premises energy monitoring system works.
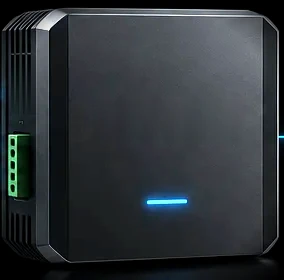 KONDUKTOR®KONDUKTOR®KONDUKTOR®
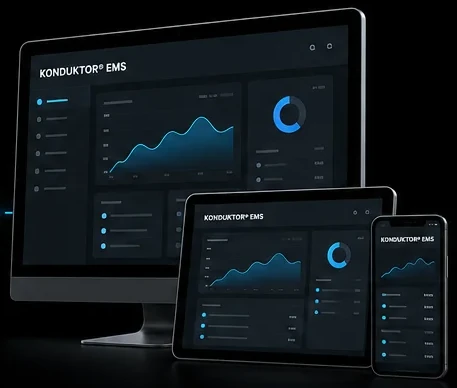 One screen, every panelPhone · tablet · PC
 Plant 2Data stays on sitePlant 3Data stays on site
Energy patterns can reveal production schedules, machine utilisation and operating volumes. KONDUKTOR® EMS keeps this information within your plant network.
Cloud outages can interrupt access. KONDUKTOR® EMS continues monitoring, logging and alerting locally—even when the Internet is unavailable.
On-premises monitoring reduces unnecessary online accounts, connections and external systems that must remain secure.
Many cloud platforms average raw readings down to hourly or daily summaries as they age. Local storage and backups keep yours at full detail, for as long as you choose.
KONDUKTOR® EMS keeps records locally accessible and exportable, reducing dependence on a cloud platform.
Access through an encrypted Zero Trust network—without opening router ports or exposing the dashboard to the public Internet.
Cloud convenience where useful. On-premises control where it matters.
Controlled industrial access, local records and dependable operation for day-to-day monitoring.
Admin, Operator and Viewer levels protect settings and plant information.
Download reports and retain backup copies of important operational records.
Signed software and firmware updates help protect system integrity.
Alert records remain available even when the monitoring browser is closed.
Monitor gateway storage status before capacity becomes a surprise.
Dashboard access, logging and alerts continue without continuous Internet dependency.
Up to 10 meters per gateway, mixing brands and single-phase/three-phase models on one shared Modbus RTU bus. Need more? Add a gateway for the next panel — no server PC, nothing to replace.
Or any MFM with Modbus RTU — share the exact meter make and model and we'll map the protocol and registers before installation.
One meter on the main supply: bill, Maximum Demand, PF and penalty alerts from day one.
Feeder-wise meters show where the energy goes, panel by panel.
Idle loads, shift-wise use and cost per unit made, machine by machine.
Plants in other cities join one dashboard and one combined report. Each keeps its data on site.
Add gateways as you grow. Each one reads its own panel, so the plant never slows down.
From Contract Demand crossings to PF savings, at a glance across every panel.
See which panels are running, idle or stopped across every shift, every day.
Live per-phase readings, with instant alerts the moment a threshold is crossed.
Reconcile every DISCOM bill against actual meter data before you pay it.
Spot waste patterns across days, shifts and seasons, not just this month's bill.
Ready numbers for ESG disclosures and sustainability audits.

“Many breakdowns I fixed had already shown up in the meters. Nobody was listening.”
For 10 years I kept plants running — paint-shop robots and PLCs at Maruti Suzuki and Tata Motors, maintenance in-charge of the weld shop at Eicher Polaris, then energy and IoT projects at Royal Enfield. At Maruti the paint shop ran about 1,750 vehicles a day; at Tata Motors I kept uptime above 96%. At Eicher Polaris I traced a recurring engine fuel pump failure to its root cause in an hour and proposed the fix that ended it — one the teams involved had struggled with for a year. Along the way I built a fault diagnostics system on shop-floor HMIs and designed a robot atomising bell testing kit that won a national design award.
Across these years I also delivered major energy-saving projects. Each one taught me the same lesson: a plant can only cut the energy it can see. And seeing it means knowing what every unit was worth — how much went into production, and how much was simply wasted.
In maintenance, fixing a breakdown is only half the job. The other half is finding the root cause so it never comes back — and that needs a record of what the machine was doing before it failed. At every plant, the warning signs were in the meter readings, but no one was making sense of them.
Then for 7 years I led purchasing at SolarSquare, building its procurement and logistics team and managing about ₹350 crore of spend a year. There, every rupee had to show a return. I built KONDUKTOR® EMS end to end in-house on that rule: every reading becomes a decision with a price on it — what to shift, what to fix, and what each one saves.
Yes. The gateway keeps reading your meters, recording data and raising alerts with no Internet at all, and the dashboard opens on any phone or laptop on the plant network. Internet is needed only for access from outside the plant and for remote software updates.
Recorded data stays safe, and the battery-backed clock keeps time — logging restarts on its own when power returns. Any energy the meters counted meanwhile is filled in as estimated, so totals still match the meter.
Usually, yes. Any multifunction meter with a Modbus RTU (RS-485) port can connect — up to 10 per gateway, any brand, single- or three-phase, on one shared cable. Send us the exact make and model and we will confirm the register map before installation. A meter without an RS-485 port cannot be read directly; we will tell you upfront.
Yes. Add a gateway for every 10 meters, usually one per panel. Each gateway reads and records its own meters on site, and all of them appear in one dashboard and one panel hierarchy, with no server PC in between.
Yes. Each plant gets its own gateways, and its data stays on site in that plant. Over the same encrypted Zero Trust network used for remote access, every plant appears in one dashboard. Head office can check each plant panel by panel, and pull one combined energy and bill report across all plants, with no cloud server in between.
Yes, on your phone or laptop, from anywhere. Access runs over an encrypted Zero Trust network, directly or through a secure relay, so no router ports are opened and the dashboard is never exposed to the public Internet. Only approved devices can connect, and the usual Admin, Operator and Viewer logins still apply.
On the gateway, inside your plant, with an encrypted backup on a computer in your plant. Nothing is sent to KONDUKTOR or to any cloud server.
Yes. Gateways read the multifunction meters on your panels over Modbus RTU and show every reading live on a dashboard. Unlike most IIoT platforms, nothing is sent to a cloud: the readings, history and alerts stay inside your plant, and owners can still view them from anywhere over an encrypted private network.
It can. It warns as Maximum Demand approaches your Contract Demand, flags low power factor, peak-hour consumption and idle machines, and estimates the savings in rupees, so your team knows what to act on. With automatic control through Modbus I/O cards, engineered for your plant as part of your project, it also holds back chosen loads, avoids peak hours and switches off idle machines by itself. Actual savings depend on your tariff, your plant and the actions taken.
Yes. The subscription covers software updates, security fixes and technical support. If it lapses, monitoring and logging pause until it is renewed — history already recorded stays on the gateway and is not deleted.
Yes. The gateway carries a 1-year warranty against manufacturing defects.
Monitoring is only the start. On the same system, KONDUKTOR® EMS goes three steps further.
Generation metered live against grid and load, and checked against today’s weather. A dusty string shows up the same day.
Running, idle and stopped time for every machine, every shift. Overloads and imbalance flagged before they become breakdowns.
Demand capped, peak hours avoided, solar and DG kept within limits, idle machines switched off. Through standard Modbus I/O, alongside your protection relays.
Start with the meters already installed
See how KONDUKTOR® EMS can monitor your meters, reveal hidden energy waste and warn your team before costly conditions reach the electricity bill.